Near Collision & Miss Reporting Analysis: Guide & Examples

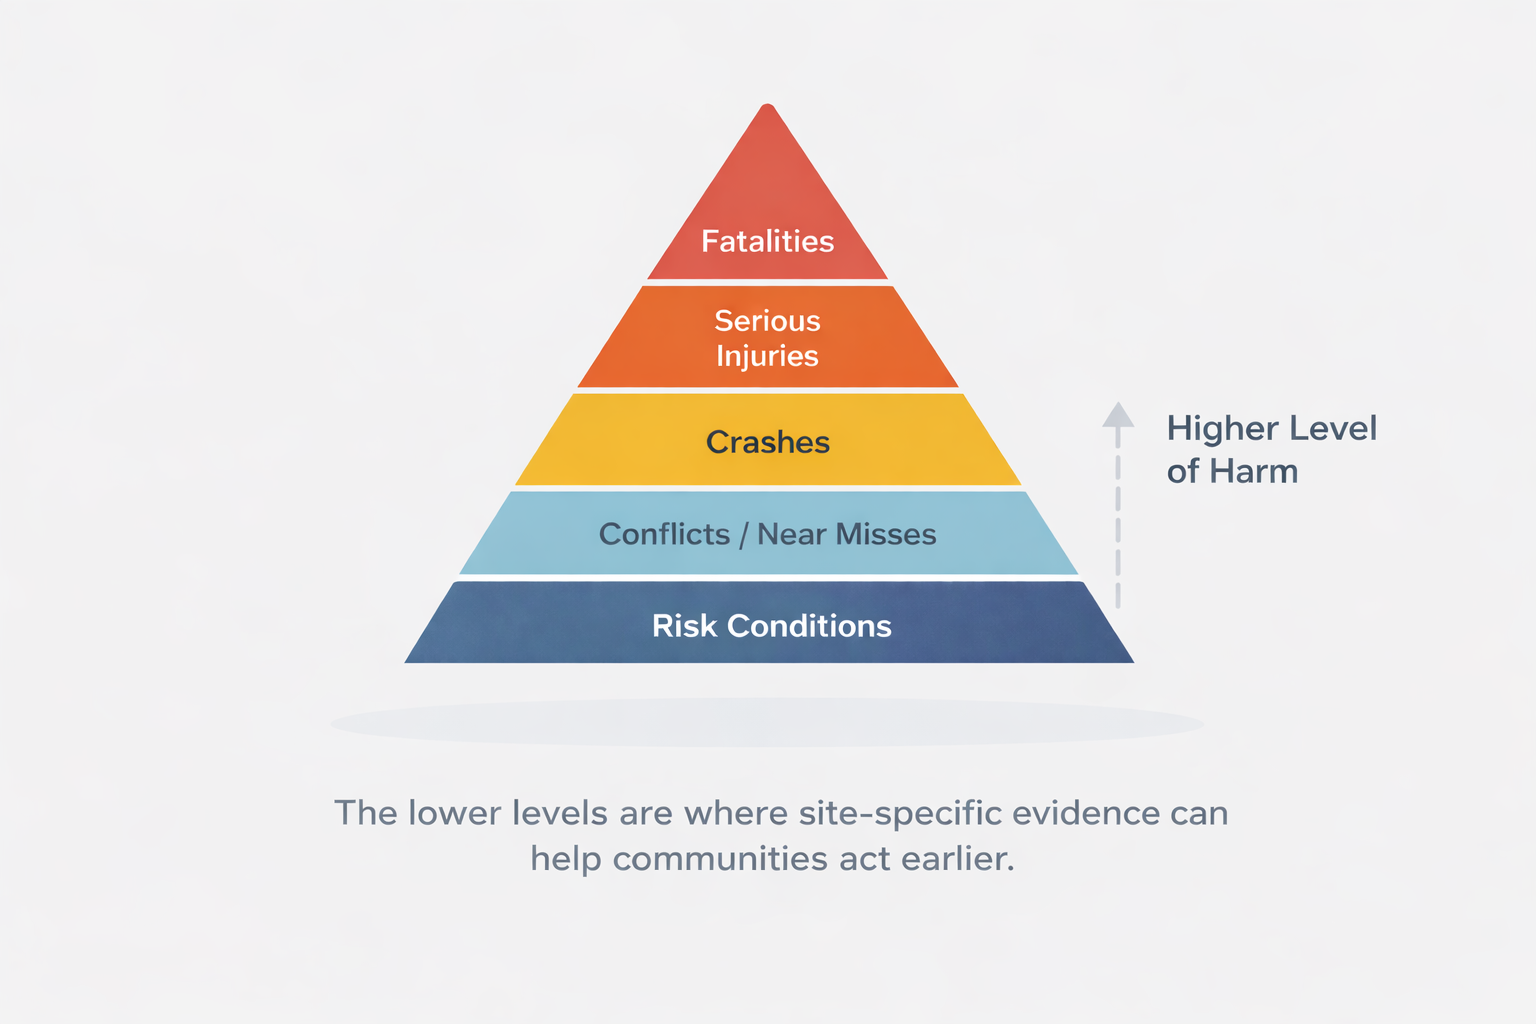
Road safety programs have historically relied on crashes as the primary signal for intervention. The problem is that crashes are lagging indicators. By the time a pattern becomes visible in police reports or claim data, the unsafe conditions have often been present for months or years. Near collision and near miss reporting analysis changes that. It gives cities, agencies, campuses, and operators a way to identify dangerous interactions before they become injuries or fatalities.
At Cumulant, we think of this as part of a broader shift toward software-defined infrastructure: existing cameras and sensors should not remain passive recording devices. They should become adaptive perception systems that can observe, interpret, and flag unsafe behavior in real time. That idea is central to our physical intelligence approach, where infrastructure becomes responsive and measurable instead of static and reactive.
What is near collision and near miss reporting analysis?
Near collision and near miss reporting analysis is the process of detecting, categorizing, and analyzing dangerous interactions that did not result in an impact, but came close enough to signal elevated risk.
In transportation settings, this often includes:
vehicles braking hard to avoid another vehicle
turning vehicles cutting across pedestrians or cyclists
red-light running conflicts
vehicles encroaching into crosswalks during active crossings
wrong-way entries
speeding vehicles that force evasive action
curbside or loading conflicts that create sudden lane changes
The key point is simple: a location does not need a crash history to have a safety problem. Near misses often appear first.
Why near misses matter more than crash counts alone
Crash data is necessary, but incomplete. Serious collisions are rare relative to the number of risky interactions that occur every day. If a city only acts after crashes accumulate, it is always working behind the problem.
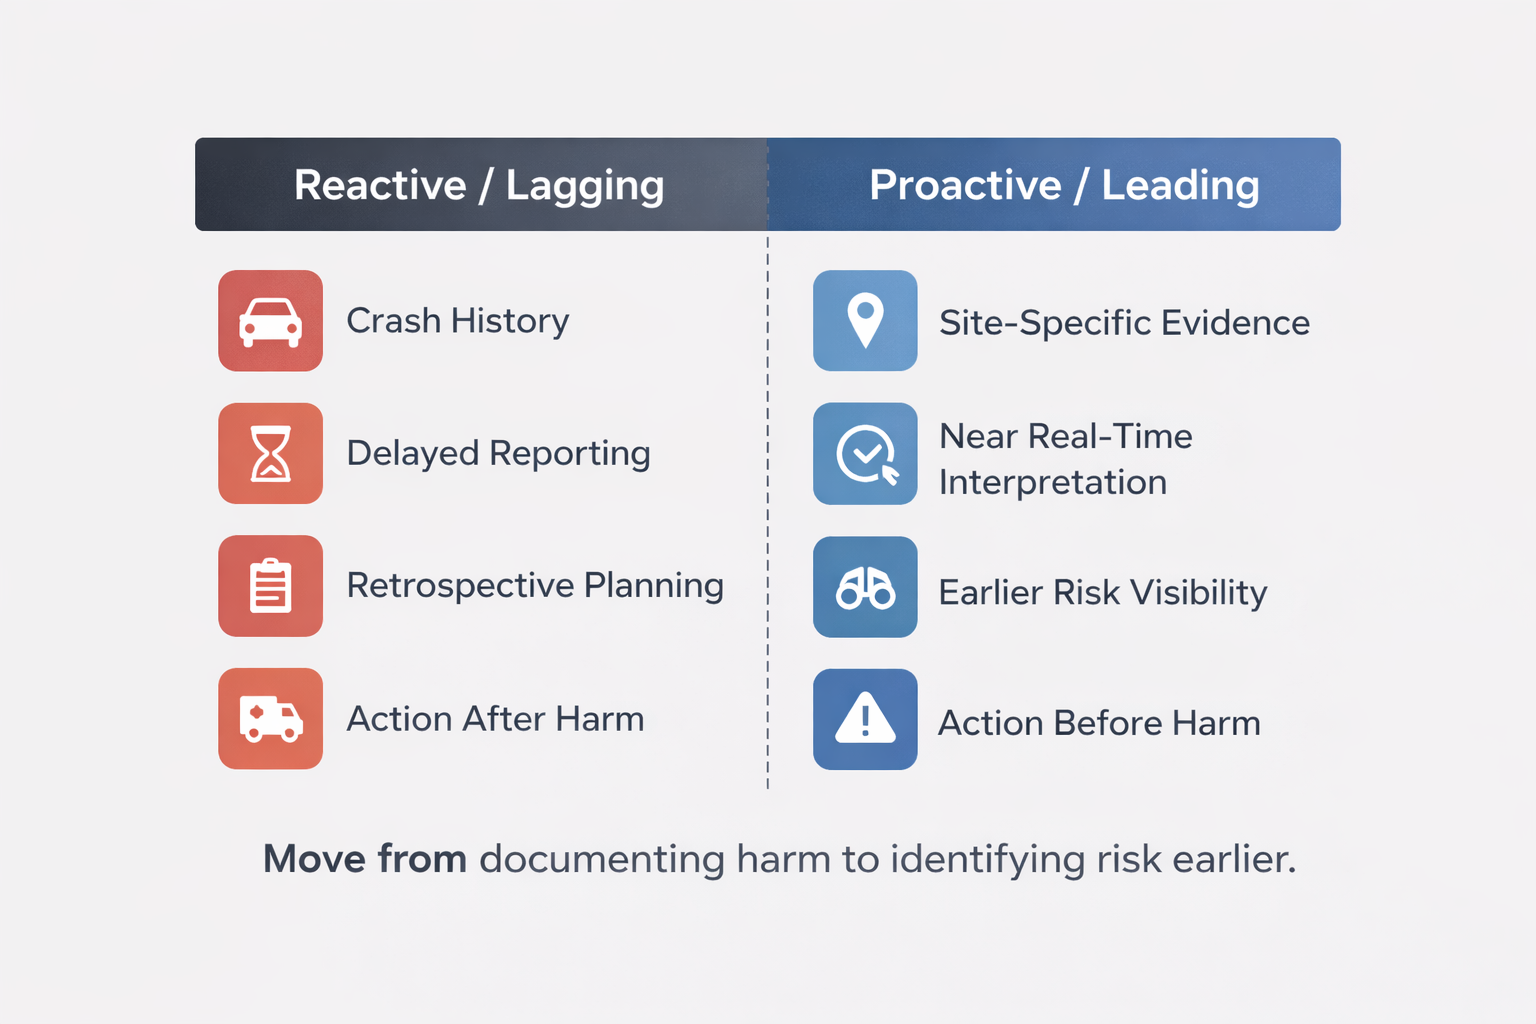
Near miss analysis offers three advantages.
First, it is proactive. It helps identify elevated risk before severe outcomes occur.
Second, it is more frequent. A corridor may only have a few reported crashes per year, but hundreds of risky interactions per month. That creates a much stronger signal.
Third, it is operational. Near miss data can be tied directly to time of day, movement pattern, signal phase, curb activity, or user behavior. That makes it much easier to decide what to change.
What counts as a near collision?
Different programs define near collisions differently, but most useful systems combine spatial proximity, trajectory conflict, and behavioral evidence.
A strong near miss event usually includes some mix of:
low time-to-collision between road users
sudden braking or evasive steering
abrupt pedestrian hesitation or retreat
encroachment into another user’s path
unusual speed differential
conflict within a defined danger zone such as a crosswalk, bike lane, or intersection box
The goal is not just to count “close calls.” It is to identify interactions that indicate a meaningful possibility of harm if conditions remain unchanged.
Traditional reporting vs AI-based analysis
Traditional near miss reporting often depends on manual review, witness complaints, officer observation, or public reporting. These methods can be valuable, but they are inconsistent, labor-intensive, and hard to scale.
AI-based analysis changes the workflow.
Instead of waiting for someone to notice and report a pattern, a city can continuously analyze video feeds or roadside sensing data to:
detect conflicts automatically
classify event types
assign severity scores
generate timestamps and evidence clips
map hotspots across an entire network
compare before and after conditions following an intervention
This is exactly the kind of transition from fixed-function hardware to adaptive infrastructure that physical intelligence makes possible. Existing devices can be repurposed into ongoing safety measurement systems rather than passive archives.
What a near miss reporting workflow should include
A good near collision analysis program should not stop at event detection. It should create a workflow from observation to action.
1. Detection
Capture risky interactions from cameras or sensing infrastructure.
2. Classification
Sort events by type, such as:
vehicle-vehicle near miss
vehicle-pedestrian conflict
vehicle-cyclist conflict
turning conflict
speeding-related intrusion
curbside obstruction conflict
3. Severity scoring
Prioritize events by likely consequence and frequency. Not every conflict deserves the same response.
4. Context tagging
Attach the event to location, time of day, weather, signal state, lane geometry, or special conditions such as school dismissal.
5. Review and evidence generation
Surface thumbnails, clips, or event logs that safety teams can review quickly.
6. Trend analysis
Identify recurring patterns:
same movement
same hour
same lane
same crossing condition
same user group
7. Intervention and remeasurement
Implement a treatment, then measure whether risky interactions actually declined.
Example 1: Unprotected left turn at a downtown intersection
A city receives occasional complaints about a downtown intersection, but crash history is limited. Traditional screening would not rank the location highly.
After deploying near miss analysis, the city identifies a recurring pattern:
left-turning vehicles enter the intersection on late yellow
pedestrians begin crossing with the walk phase
drivers focus on opposing traffic gaps and fail to register pedestrians until late
pedestrians hesitate or step backward to avoid impact
Over 30 days, the system detects a large cluster of vehicle-pedestrian conflicts during the evening peak.
What changed:
leading pedestrian interval added
left-turn timing adjusted
signal visibility improved
What near miss analysis shows after treatment:
fewer high-severity conflicts
shorter conflict duration
reduced evasive behavior by pedestrians
This is the value of near miss reporting: it makes invisible risk measurable.
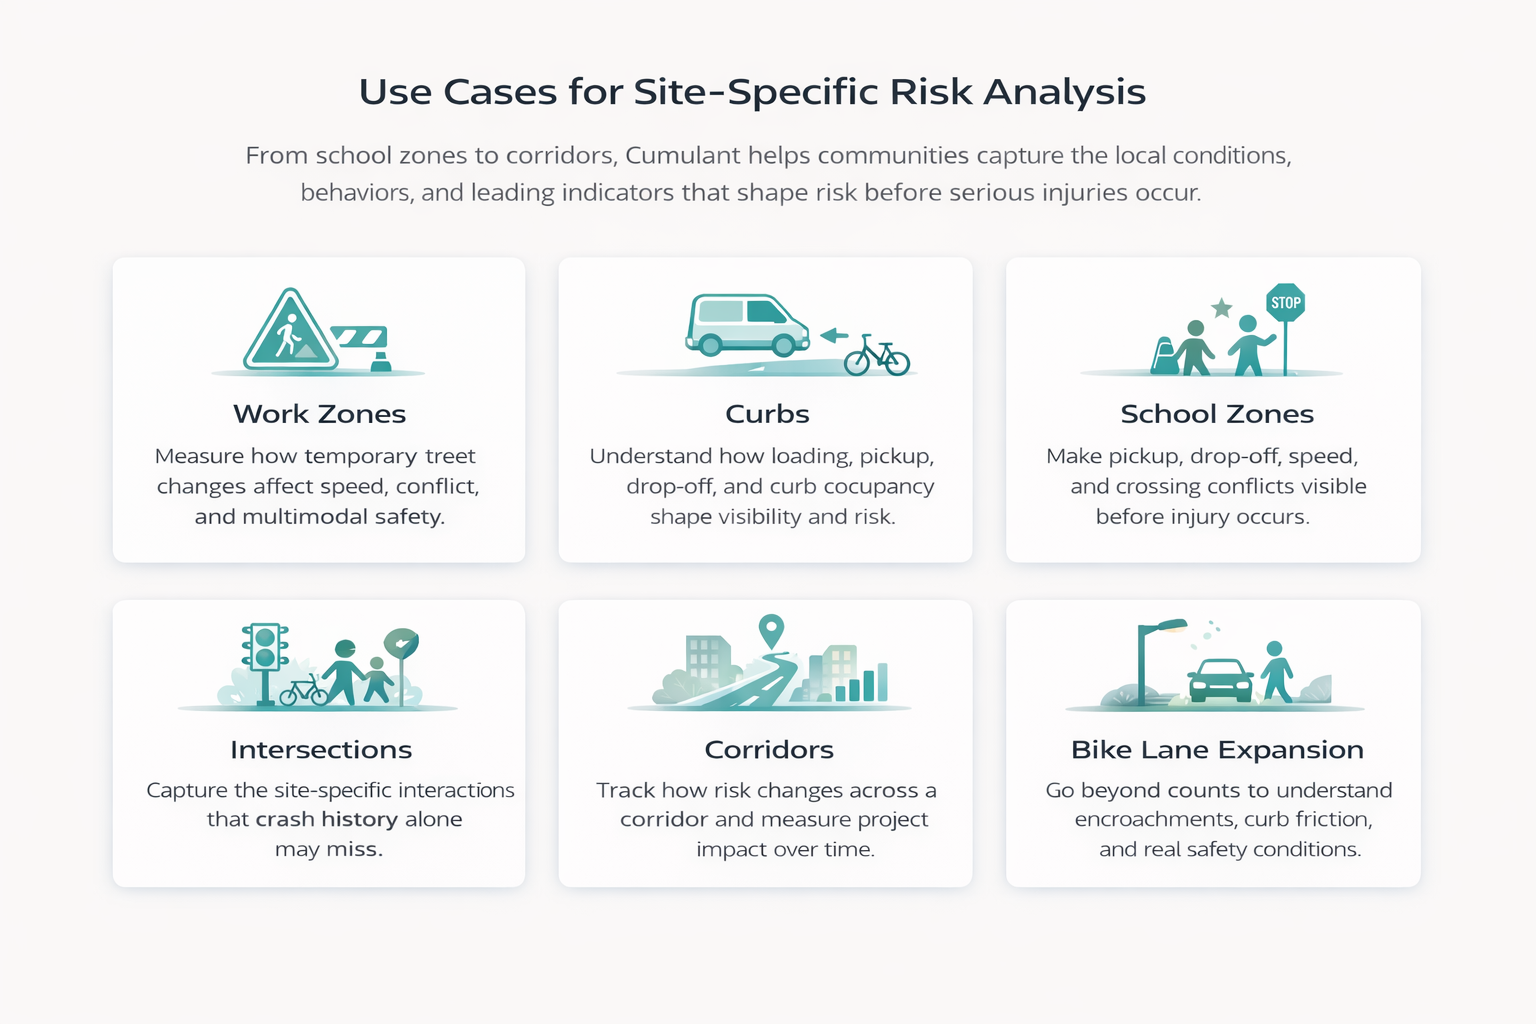
Example 2: School zone speeding and late yielding
A district wants to improve safety around a school, but enforcement staffing is limited and observations are sporadic.
Using AI-based event detection, the agency analyzes arrival and dismissal periods and finds:
repeated speeding during 20-minute windows
low driver yielding compliance at an unsignalized crossing
near misses concentrated when curbside pickup activity spills into the travel lane
The analysis shows that the issue is not simply “speeding in general.” It is a specific combination of vehicle speed, curbside disorder, and crossing demand at certain times.
Recommended actions:
targeted pickup/drop-off management
temporary curb restrictions
flashing beacon timing adjustment
speed feedback deployment
crossing guard support during the highest-risk interval
Because the near miss data is timestamped and location-specific, the intervention can be much more precise.
Example 3: Bike lane intrusion on a commercial corridor
A corridor has no severe bicycle crashes on record, but riders report feeling unsafe. Near miss reporting reveals frequent delivery vehicles stopping in the bike lane, forcing cyclists into mixed traffic.
The system identifies:
repeated illegal parking and intrusion events
cyclist swerves into the adjacent lane
high conflict concentration during freight delivery windows
Instead of waiting for a serious injury, the city now has operational evidence to justify:
loading zone redesign
curb management changes
enforcement targeting
protected delineation upgrades
What metrics should be tracked?
For a near collision program to be useful, the outputs need to be simple enough for operations teams and rigorous enough for engineering teams.
Common metrics include:
total near miss count
high-severity near miss count
near misses by movement type
near misses by hour, day, or season
near misses per 1,000 vehicles or pedestrians
repeat conflicts at the same location
average severity score by site
before/after change following treatment
event heatmaps across the network
The best programs also connect near miss data to exposure. A site with ten near misses may be less risky than a site with five near misses and much lower traffic volume. Context matters.
What makes a good near miss report?
A useful report should answer five questions clearly:
What happened?
Where did it happen?
How often is it happening?
How severe is it?
What should we do next?
A practical report often includes:
executive summary
map of conflict hotspots
breakdown by event type
peak risk time windows
representative event images or clips
likely contributing factors
prioritized recommendations
before/after comparison if a treatment has been installed
Common mistakes in near miss analysis
One mistake is treating every close interaction as equally important. Good analysis distinguishes between routine friction and genuine risk.
Another is reviewing events without exposure context. Counts alone can mislead.
A third is collecting data without an action framework. Detection matters, but decision support matters more.
A fourth is using infrastructure only as storage. Cameras that merely record are underutilized. The stronger model is to use the installed base as an active safety intelligence layer that can be updated, tuned, and aligned to changing operational needs over time. That broader principle is consistent with Cumulant’s view that hardware should evolve after deployment rather than remain frozen in a single function.
How cities and operators can start
Organizations do not need to rebuild infrastructure from scratch to start using near miss analysis.
A practical rollout usually looks like this:
select high-priority intersections, school zones, corridors, or worksites
connect existing camera infrastructure where possible
define event types and severity logic
run a baseline measurement window
review hotspots and contributing patterns
prioritize countermeasures
remeasure after intervention
This approach is faster, more scalable, and more cost-effective than relying only on manual field observation.
The future of safety analysis
The future of safety will not be built solely on crash history, periodic studies, or manual review. It will be built on continuous perception, contextual analysis, and fast feedback loops.
Near collision and near miss reporting analysis is one of the clearest examples of that shift. It turns passive infrastructure into an operational safety system. It gives agencies earlier signals, stronger evidence, and a more defensible basis for action.
Most importantly, it helps move road safety from reactive investigation to proactive prevention.
Conclusion
Near misses are not minor events to ignore. They are early warnings. When cities and operators can detect them systematically, classify them accurately, and analyze them at scale, they gain a much clearer picture of where risk is building and why.
That is the real value of near collision and near miss reporting analysis: not just better reporting, but better intervention.